This output plots the evolution with time, during the earthquake, of the displacement of the top of the wall (see the figure below), and represents the main feature of DReW Seismic. In the figure below, u represents the displacement of the wall top towards the excavation, θ is the wall rotation and Y is the distance between the center of rotation and the wall base.
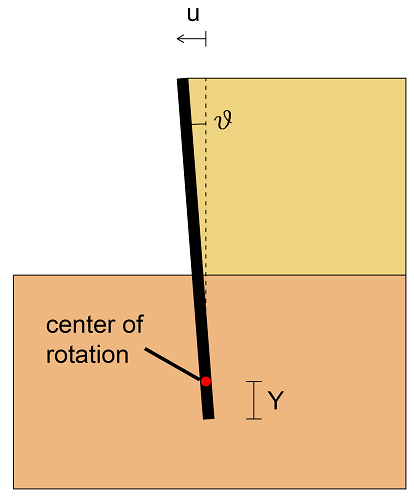
Movement undergone by the wall during the earthquake
The output will look like the following figure.
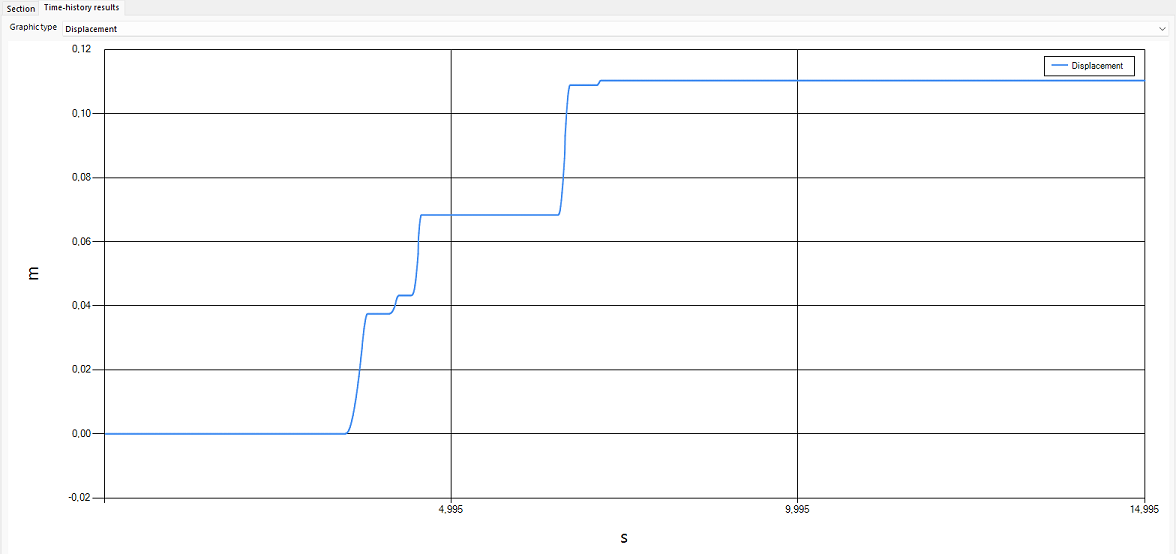
Evolution with time of the displacement of the top of the wall
In addition, in DReW Seismic it is possible to compare the calculated displacement time-history with that eventually recorded in field (for example in case of a back analysis). To this purpose, right click on the graph and click on "Compare with real values" so that a new window will appear. Now, select the folder where the real measurements are saved and upload the file containing the real measurements. These latter must be provided through a .txt file. After the file is selected, the comparison will look like the following figure.
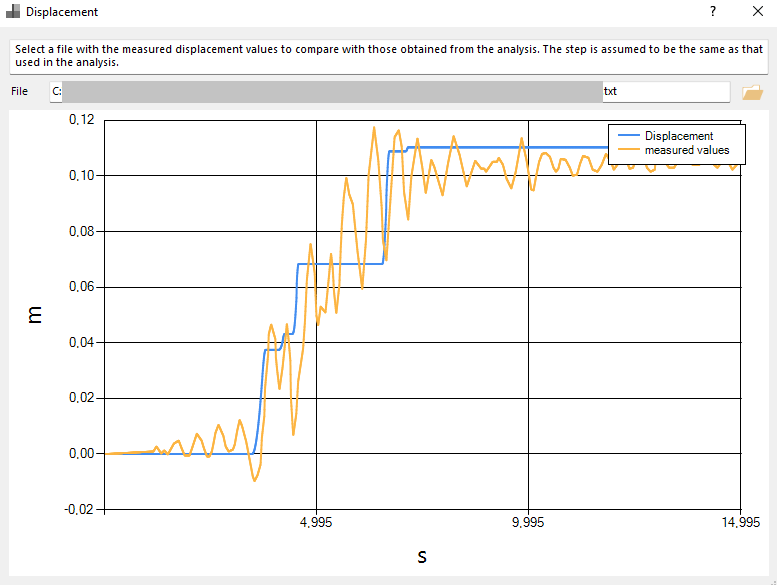
Comparison between calculated and measured displacement